


Technical Analysis: Decoding Chart Patterns With Indicators
Jun 08, 2018 | 19:15 PM IST
Jun 08, 2018 | 19:15 PM IST
After learning the basics of technical analysis one can only get acquainted with the terminology of technical analysis for technical analysis is a vast discipline of study. More you learn, more you would feel the need of learning. The point being, there are too many theories, concepts, assumption and interpretation that you will never find a point where you can claim that you know everything. Therefore, the key to learning any new concept is to grasp the elements which matter the most. In the context of technical analysis, you have to understand the concepts which will have a direct effect on your day-to-day trading.
Let's advance to the next level of learning technical analysis.
Contents
The Candlestick Patterns
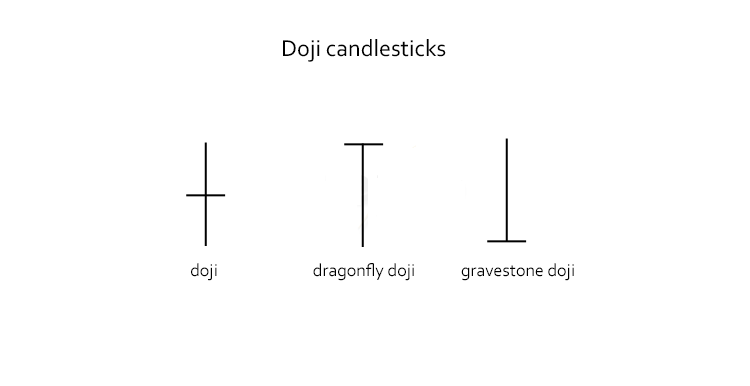
Doji
The doji candlestick pattern happens when the opening and closing of the stock is virtually the same. A doji is a reflection of intense tag-off war between buyers and sellers. The buyers don't let the price fall and the sellers don't let the price rise. In this scenario, the price moves up and down but closes near the point of the opening which forms a doji pattern. A broader interpretation of a doji is a trend reversal. Whenever a doji appears in an uptrend it can be interpreted that the current trend is about to reverse and vice versa. There is also a dragonfly doji which looks like 'T'. It carries the same significance as the regular doji.
Marubozu
Marubozu is a Japanese word. It means a bald or a shaved head. The reason the candlestick pattern is called Marubozu is that the Marubozu candle has no shadow on either side. It has a long body which shows aggressive price movement in one direction. The interpretation driven from a Marubozu candle is that the ongoing trend will continue. Essentially, a Marubozu candlestick is a trend-continuation candle. This means, if it appears in a downtrend the downtrend will continue and vice versa.
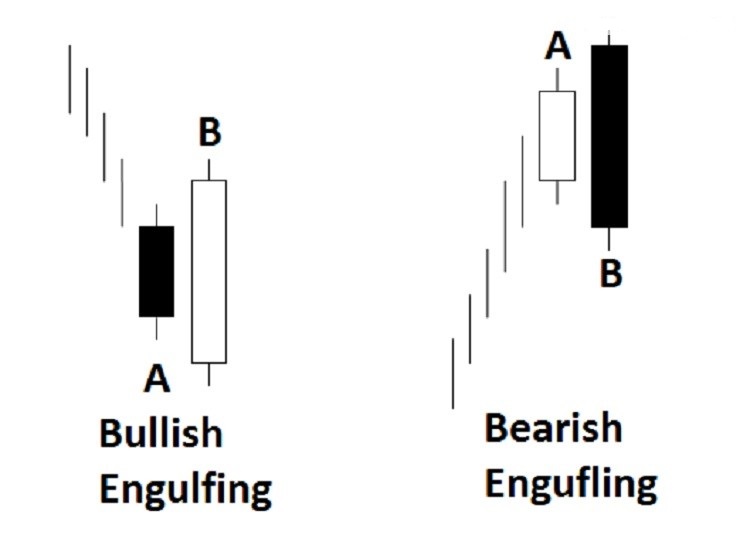
Engulfing Pattern
In an engulfing pattern, the first day's candle has a small body, it is followed by a candle whose body completely engulfs (means - covers) the previous day's body and closes in the opposite direction of the trend. A reversal pattern that can be both bearish or bullish. If it appears at the end of an uptrend it is considered the bearish engulfing pattern. In the same line, when it appears at the end of a downtrend it is called bullish engulfing pattern.

Morning Star
Is a bullish reversal pattern. A morning star pattern happens over a course of three days if you are using a day candle. The pattern consists of three candlesticks - a long-bodied red candle that signifies the current downtrend, it is followed by a short middle candle that opens gapped down (this one looks like a Doji) and the third candle is a long-bodied green candle that opens gap up and closes above the midpoint of the body of the first candle. This is one of the most reliable reversal patterns in the technical analysis. The point to remember here is that for this pattern to be relevant, it is important that it happens at the end of a downturn.
Evening Star
Exact opposite of morning star is the evening star. In this pattern there is a long-bodied green candle that signifies the current uptrend, a short middle candle that opens gapped up and the third candle is a long-bodied red candle which opens gap down and closes below the midpoint of the body of the first candle. Like in the morning star, this pattern can only be trusted if it happens at the end of an upturn.

Harami Pattern
Harami is a Japanese word. It means a pregnant woman. The Harami pattern builds over a period of 2 days. It has long candle followed by a small candle of the opposite colour which appears in the middle of the body of the previous candle. A Harami pattern is both bullish and bearish. The harami pattern suggests that the uncertainty has crept into the market and the reversal might be around the corner.
There are many more candlestick patterns like Hangman, Hammer, inverted hammer, etc. You will understand these pattern gradually as you go along learning technical analysis. The above mentioned are some of the most important patterns which are regularly used by the professional traders.
The Chart Patterns
A candlestick pattern is the one in which only one or at the most three candlesticks are involved. Similarly, there are chart patterns where a number of candles form a certain design or pattern which gives away the quintessential behaviour of the traders. The basic assumption is that traders tend to behave in the same manner in the same situations, their behaviour perfectly reflects in the chart patterns. The chart patterns are of two types - reversal and continuation. These chart patterns are usually seen on the daily or weekly candle. Chart patterns can't be as conclusive as the candlestick patterns are as one needs to have a higher level of expertise to identify the chart patterns in the formative stages as to derive optimum benefit out of them.
Let's look at some of the most prominent chart patterns.
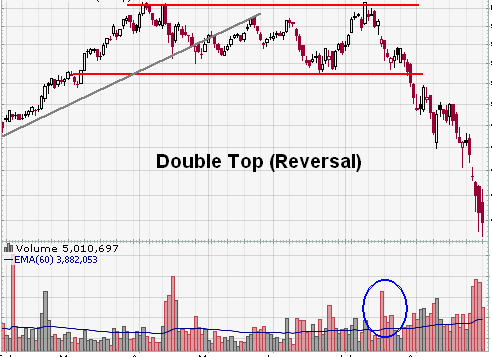
Double Top Reversal Pattern
The double top pattern forms when the stock/index makes two consecutive peaks virtually on the same level and there is a formation of a 'V' shape between the two peaks. A double top pattern is a reversal pattern. In most cases, it is assumed that once the second peak is formed the price will take a steep fall from that point. When the price goes down from the second peak it takes support at the lower level. Though the pattern is not complete till the support level is broken at the lower level on the back of increased volumes.
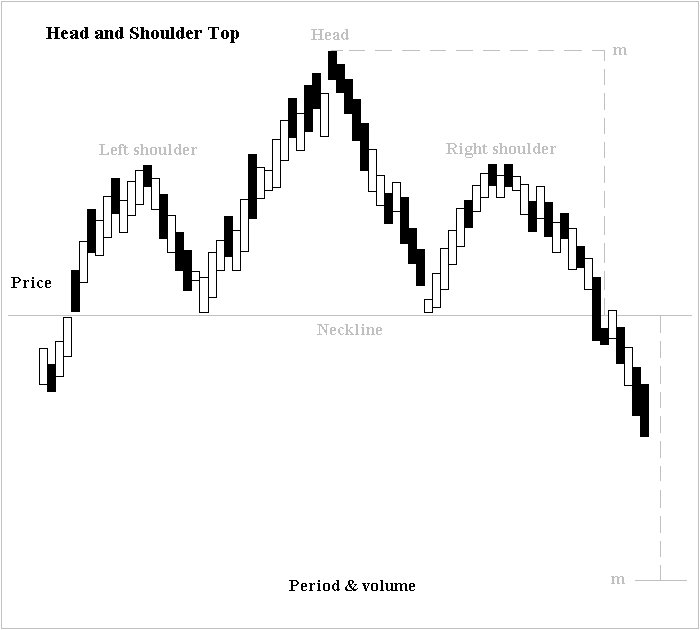
Head And Shoulders Pattern
A Head and Shoulders pattern happens in an uptrend, the pattern's completion is marked as trend reversal. This pattern consists of three consecutive peaks. Amongst these three, the middle peak, known as the head, stands tallest while the two peaks (shoulders) on either side, are low and mostly on the equal level. The confirmation of pattern can be considered when the reaction lows of all the peaks can be connected on the same level. This level is called a neckline.
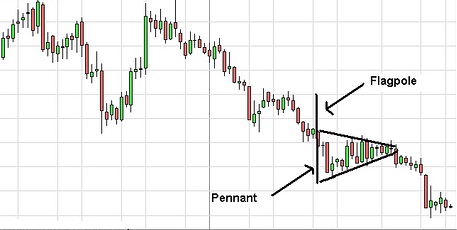
Flag Pattern
Flag pattern is a short-term continuation pattern. The formation of the pattern starts with a small consolidation before the price starts moving in the direction it was moving in before consolidation. Generally, this pattern is preceded by a marked hike or decline in high volume, and mark a midpoint of the move. When you draw tradelines around all the closing and opening points you get a see a shape of a flag or a pennant.
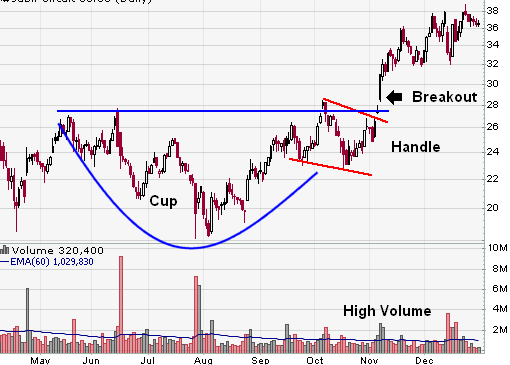
Cup With Handle Pattern
The Cup with Handle is a bullish continuation pattern. This pattern marks a consolidation of a price action which is followed by a breakout. As the name suggests, the pattern forms a shape of the cup and the handle. The shape of the cup formed after an advance and takes a rounded bottom shaped bowl. Once the cup is completed, the handle gets formed as the trading range develops on the right-hand side. At the end of the pattern, a breakout from the handle's trading range signals a continuation of the prior trend.
There are various other chart patterns like a Falling Wedge, Rising Wedge, Symmetrical Triangle, Rectangle, which are used by traders.
Importance of Volume - All the chart and candlestick patterns are only confirmed when the share price movement happens on the back of considerable hike in the volumes. This is the condition for confirming all the patterns.
Key Tools Used By The Professional Traders
Moving Averages
The most popular tool is the 200-day moving average. All you need to do is plot the 200-day moving average on the price chart. When the stock price moves above the moving average line, it's considered as a buy signal. In the same line, when the stock price drops below the moving average line, it is seen as a sell signal. Like 200-day MA, you can also look the 50-day moving average or even lesser. Many of the traders use two moving average lines on a chart. The most popular combination is 200-day and 50-day. There is also a theory about two lines intersecting. When the 50-day line intersects the 200-day line from below it is an indicator that the prices are moving up and when the 50-day line intersects the 200-day line from above it means the price drop in future.
Relative Strength Index (RSI)
Support and resistance is not an indicator but these are levels which are identified by taking into account various things. Plotting support and resistance and finding it on a technical chart is a quite an easy job. The stock prices don't move in a straight line they move in a zig-zag fashion and form various highs and lows. The general method is that the daily low price is seen as a support zone while the resistance level is at the daily high price. As and when the breakouts happen the earlier resistance level becomes a new support while the price finds a new resistance level above.
Support & Resistance
RSI analyses the degree of recent gains to recent losses to understand if the stock is oversold or overbought. RSI is measured on a scale of 0-100. Usually, if it is above 70, it is considered that the stock is overbought so the trader can initiate sell on it. Likewise, when RSI is less than 30, it means the stock is oversold, therefore can be bought. RSI like moving averages is the most widely used indicators. Professional traders always have RSI indicator on their screens. The reason is that RSI gives near a perfect indication of increasing and decreasing strength in the stock which is a vital information to take entry-exit calls.
Conclusion
Technical analysis, as I said above, is a never-ending subject. To get better at technical analysis one has to be vigilant while watching the charts. There are various indicators and oscillators available which come in handy but they are not entirely reliable. The success of a technical analyst lies in building a skill set which sees the trend forming little ahead of others and taking action accordingly. It is easier said than done but with practice one can have complete command on charts. That is the reason it is important to engage in regular practice of reading charts and building your trade ideas in the live market and backtesting them before executing.


At Niveza India Pvt Ltd., we all come to work everyday to take the challenges of stock market head on and to change people's perception that stock market investment is like a gamble. Over the years, we have built our profile as a company which has brought optimum value to our subscribers through our well-researched stock recommendations.... More>>
Disclaimer: Niveza does not guarantee the accuracy or completeness of information on the site, nor does Niveza assume any liability for any loss that may result from reliance upon any such information or recommendations. Information and recommendations on the site are for general information only. Nothing contained herein is an offer to sell nor solicitation to buy any securities.